Brain Tumor MRI Classification Using a Hybrid CNN-ViT Model with Interpretable Evidence Map
Abstract
This work evaluates a hybrid CNN-ViT model for multiclass brain tumor MRI classification with class specific evidence maps for interpretability. The model was trained on MRI images labeled as glioma, meningioma, pituitary, or no tumor and compared against a baseline classifier, a CNN, and a ViT model. The hybrid model achieved the strongest overall test accuracy and F1 score among the models compared with the largest gains on meningioma and glioma. The evidence mechanism used a learned refinement stage along with sparsity, smoothness, and outside anatomy regularization so that positive tumor class evidence would be discouraged from moving onto background or image border artifacts. In the examples shown, the evidence maps generally stayed within plausible anatomy but they should still be interpreted as class evidence rather than precise tumor segmentations. The hybrid model classifies well and provides useful evidence maps but its explanations are not yet reliable enough to support clinical decisions on their own.
Introduction
Brain tumor diagnosis relies heavily on medical imaging and magnetic resonance imaging (MRI) is commonly used because it provides detailed images of the brain and is considered one of the primary tests for finding brain and spinal cord tumors [1]. At the same time, the growing availability of MRI datasets and advances in deep learning have made automated brain tumor analysis an active area of research with current models being used for tasks such as segmentation, quantification, and classification [2]. These systems have the potential to support clinical workflows but a prediction score alone is not enough in a healthcare setting. Health care workers need to understand not only what conclusion a model has reached but also why the model reached that conclusion.
This need is especially important because deep learning models can behave like black boxes. In high stakes settings, Rudin argues that models should be designed with interpretability in mind rather than relying only on explanations created after the model has already made its decision [3]. Chen et al. describe transparency as a relationship between an algorithm and its users and warn that explanation methods that do not consider clinical stakeholders can become difficult to understand and clinically irrelevant [4]. For a brain MRI classifier, an interpretable prediction should therefore do more than label an image by its class. It should also show the image regions that contributed to the prediction so a user can evaluate whether the model is focusing on plausible anatomy instead of image artifacts.
This paper builds and evaluates a neural network model for multiclass brain tumor MRI classification while incorporating interpretability directly into the prediction process. For our analysis, we use the Kaggle Brain Tumor MRI Dataset which contains MRI images categorized into four classes of glioma, meningioma, pituitary, and no tumor [5]. The primary model is a hybrid CNN-ViT architecture with a class-specific evidence map designed to show where positive evidence for a prediction is located. We compare this model with simpler CNN and ViT baselines.
Data Exploration and Preprocessing
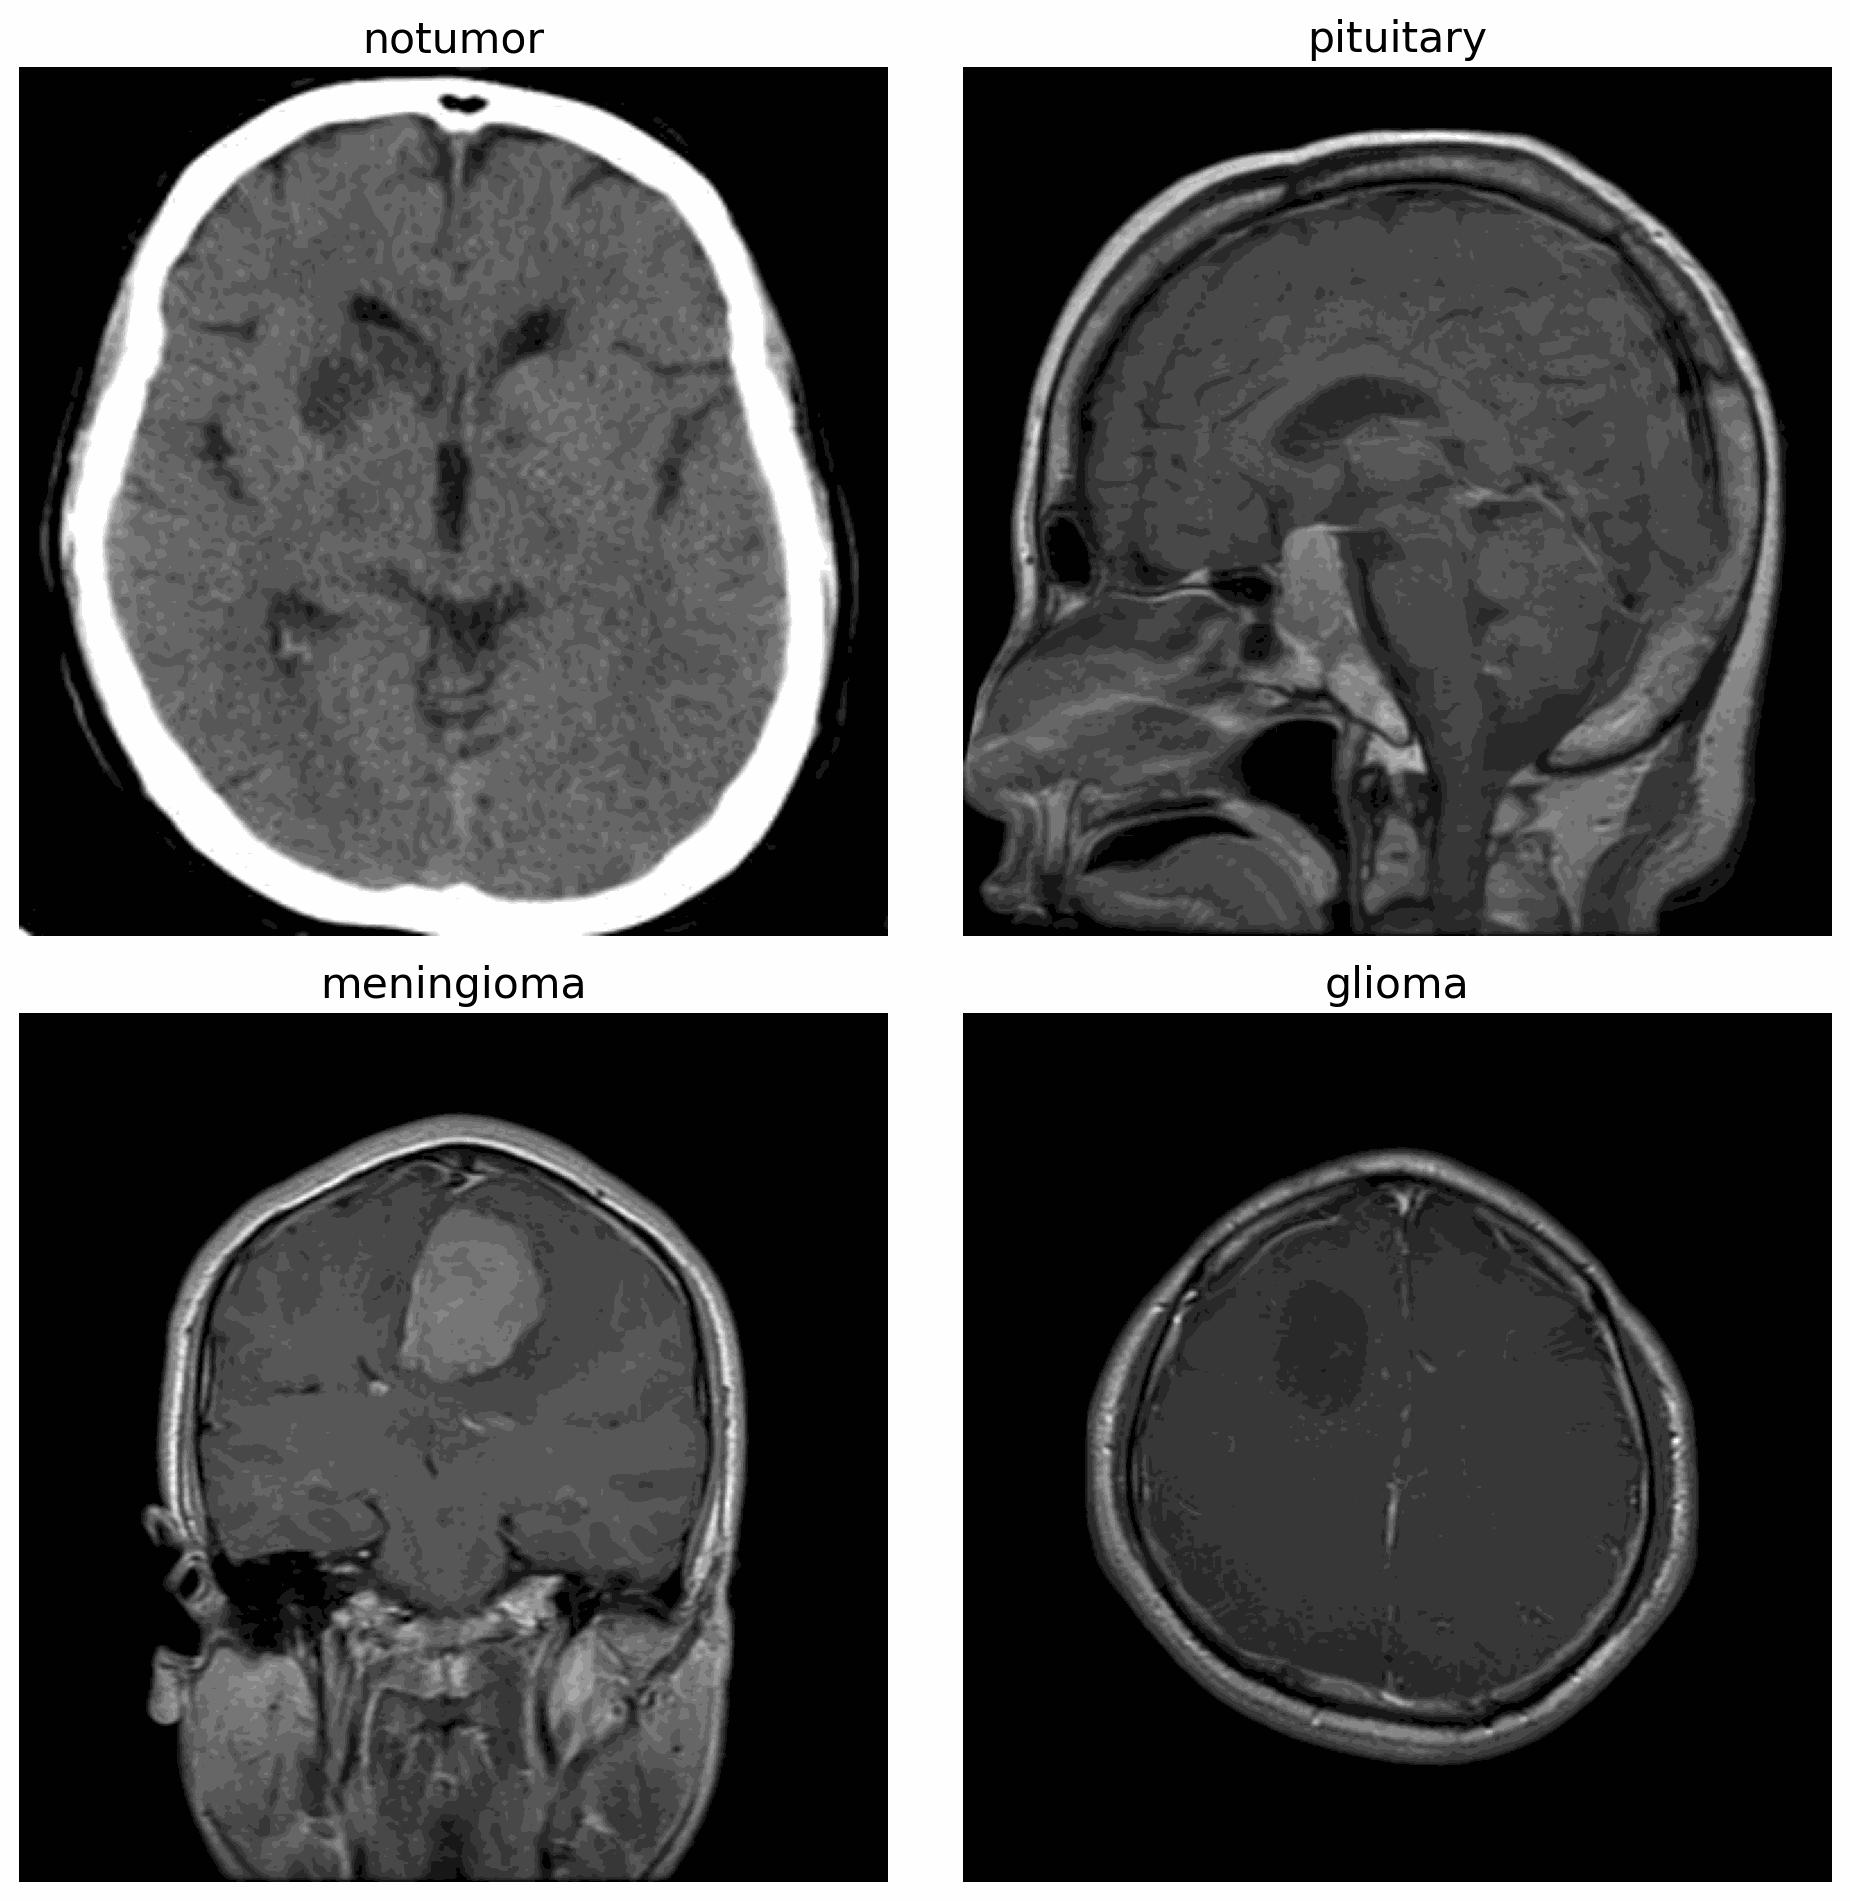
We used the Brain Tumor MRI Dataset from Kaggle. This dataset contains MRI images grouped into four classes of no tumor, pituitary, meningioma, and glioma. The training images varied in size with minimum dimensions of 150 x 168 pixels, maximum dimensions of 1,375 x 1,446 pixels, and an average size of approximately 458.51 x 462.26 pixels. To create consistent model inputs we processed each image by converting to grayscale, resizing to the target image size of 384 x 384 pixels, and normalizing to floating point values between 0 and 1. Each step had a clear motivation. Grayscale conversion was appropriate because MRI does not encode information in color. Resizing was required so images could be batched through the same architecture. Normalization keeps input values on a stable scale which helps convergence. After preprocessing, the original training set was split into training and validation sets which resulted in 4,480 training samples, 1,120 validation samples, and 1,600 testing samples.
Model Architecture and Tuning
Several models were included so that the hybrid architecture could be evaluated against simpler approaches. The first was a naive baseline model that always predicted the no tumor class which provided a minimum reference point for performance. The CNN model was used as a more conventional image classification approach because convolutional layers are well suited for learning local visual patterns. This model contained four convolutional blocks with channel sizes of 32, 64, 128, and 256. Each block used a 3 x 3 convolution, batch normalization, ReLU activation, and 2 x 2 max pooling. After these convolutional blocks, the learned feature map was flattened and passed through a fully connected layer with 512 neurons, dropout of 0.5, and a final four class output layer. A ViT model was also included to test a more attention based approach. The ViT divided each 384 x 384 MRI image into 16 x 16 patches, producing 576 patches per image. These patches were processed using an embedding dimension of 256, 6 transformer layers, 8 attention heads, a 512-neuron MLP dimension, and a final four class output layer.
The main model for this project combined these two ideas in a hybrid CNN-ViT architecture with evidence mapping. Rather than sending image patches directly into a transformer, the image first passed through a compact CNN feature extractor. This extractor used three convolutional layers where the first mapped the grayscale input from 1 channel to 32 channels, the second mapped 32 channels to 48 channels, and the third mapped 48 channels to the tuned CNN feature dimension. Each convolution used a 3 x 3 kernel, batch normalization, and GELU activation, with max pooling applied after the first two layers. The resulting feature map was then processed by a convolutional vision transformer (CvT) with three transformer stages. These stages used embedding dimensions of 64, 80, and 96, with 1, 2, and 2 attention heads respectively, and a depth of 1 in each stage. Instead of ending with only a standard fully connected classifier, the hybrid model used a learned evidence refinement stage that upsamples the transformer features and reduces them from 96 to 64 channels before a 3 x 3 convolutional evidence layer produces one evidence map for each output class. These evidence maps were pooled with log-sum-exp pooling to produce the final class logits while the loss used L1 sparsity, total variation smoothness, and an “outside anatomy” penalty to discourage evidence from drifting onto background or image border artifacts. This design was chosen because the CNN portion can capture local image features while the transformer portion can model broader spatial relationships. Thus allowing the final model to combine both local and global information while also producing class-specific evidence maps.
Hyperparameter tuning was done using Optuna which is a framework for automatic hyperparameter optimization. Optuna works by running a sequence of trials where each trial trains the model using a sampled set of hyperparameters and then records validation loss. Optuna attempts to optimize the hyperparameters to minimize the validation loss. The final run used Optuna’s Tree-structured Parzen Estimator sampler with 20 trials per model and 5 training epochs per trial.
The CNN and ViT searches tuned learning rate and weight decay. The hybrid CNN-ViT search tuned learning rate, weight decay, dropout, and the CNN feature dimension. The evidence L1, total variation, and outside anatomy weights were fixed because these evidence penalties directly affect the evidence map behavior. These selected hyperparameters were then used when training the final versions of each model.
| Tuning result | CNN | ViT | Hybrid CNN-ViT |
|---|---|---|---|
| Learning rate | 8.3201e-05 | 4.2105e-04 | 2.2119e-04 |
| Weight decay | 4.9799e-05 | 8.9128e-06 | 6.9241e-06 |
| Evidence L1 weight | N/A | N/A | 0.0050 |
| Evidence TV weight | N/A | N/A | 0.0050 |
| Evidence outside-anatomy weight | N/A | N/A | 0.2000 |
| Dropout | N/A | N/A | 0.1000 |
| CNN feature dimension | N/A | N/A | 48 |
Model Evaluation and Comparison
Hybrid CNN-ViT Evaluation
Hybrid CNN-ViT Test Metrics:
Accuracy: 0.9363
Precision: 0.9401
Recall: 0.9363
F1 Score: 0.9346
Mean evidence magnitude: 0.4437
Outside anatomy evidence ratio: 0.0010

Hybrid CNN-ViT Classification Report:
              precision    recall  f1-score   support

     notumor       0.90      1.00      0.95       400
   pituitary       0.95      1.00      0.98       400
  meningioma       0.91      0.95      0.93       400
      glioma       0.99      0.80      0.88       400

    accuracy                           0.94      1600
   macro avg       0.94      0.94      0.93      1600
weighted avg       0.94      0.94      0.93      1600
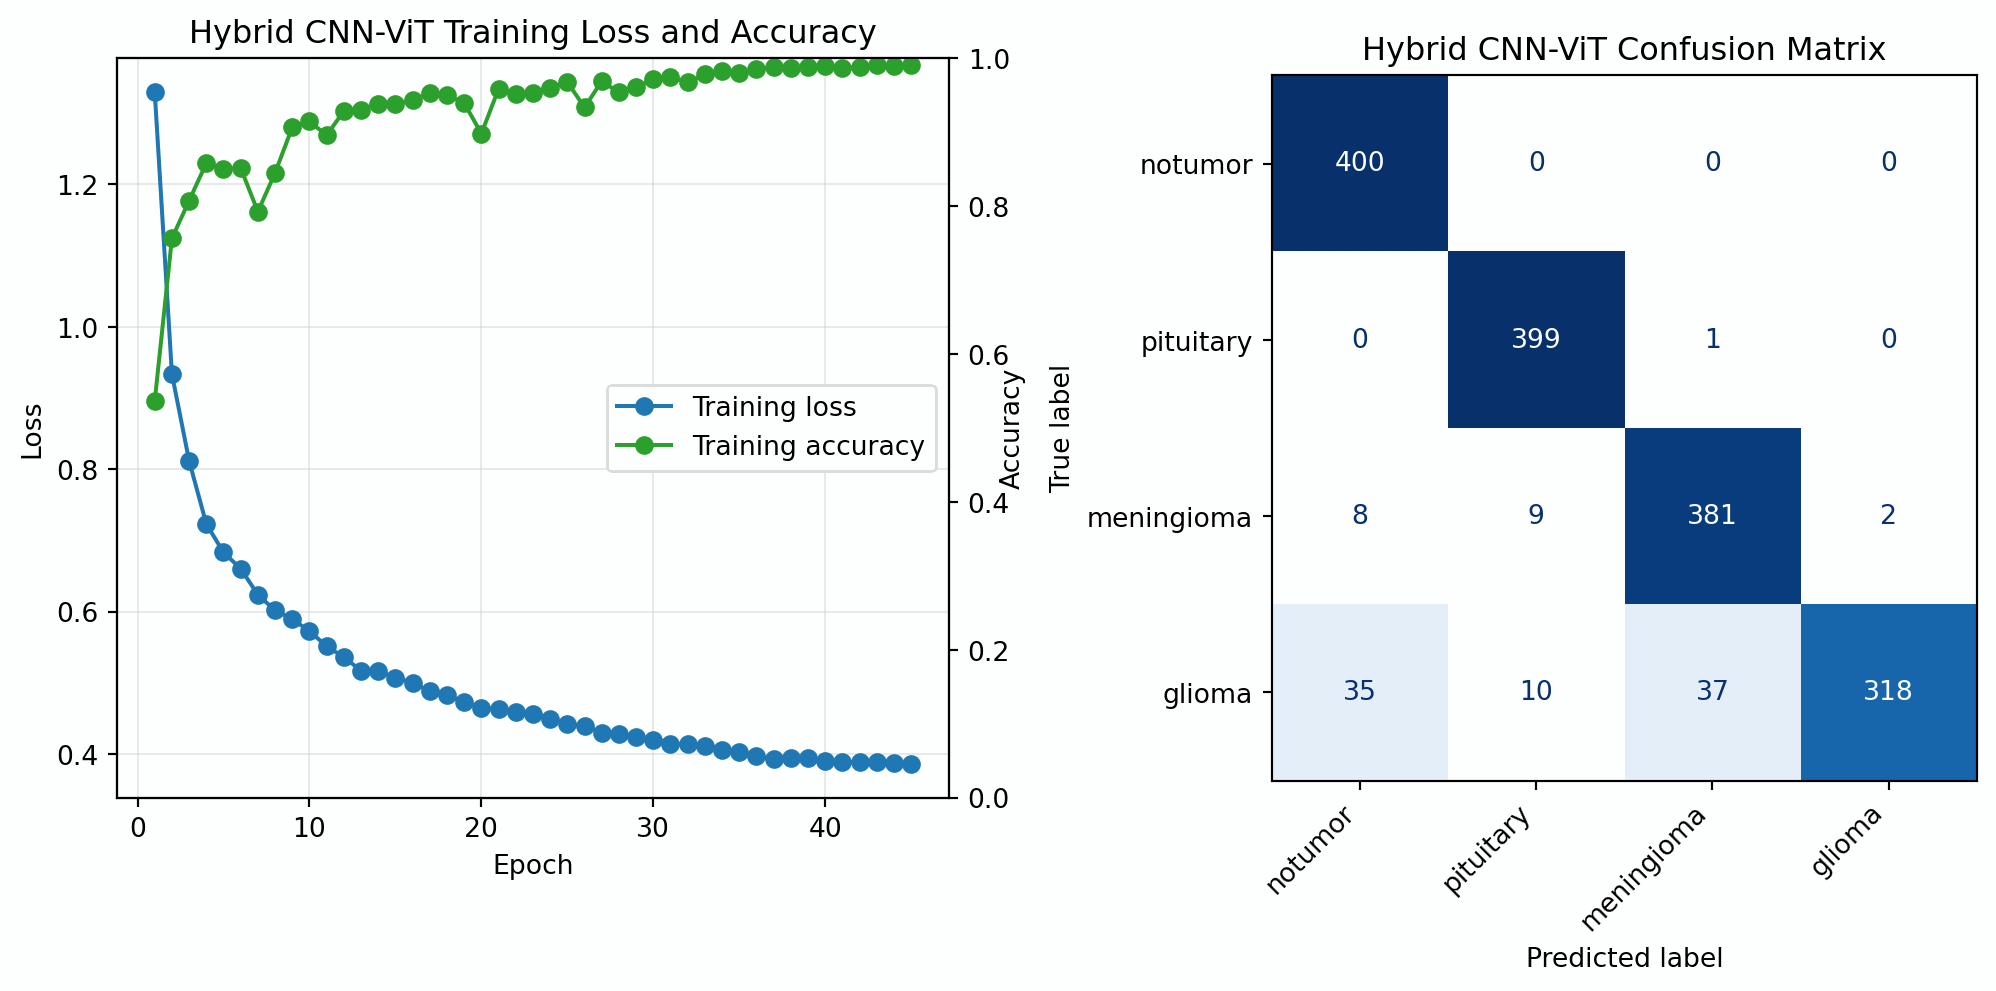
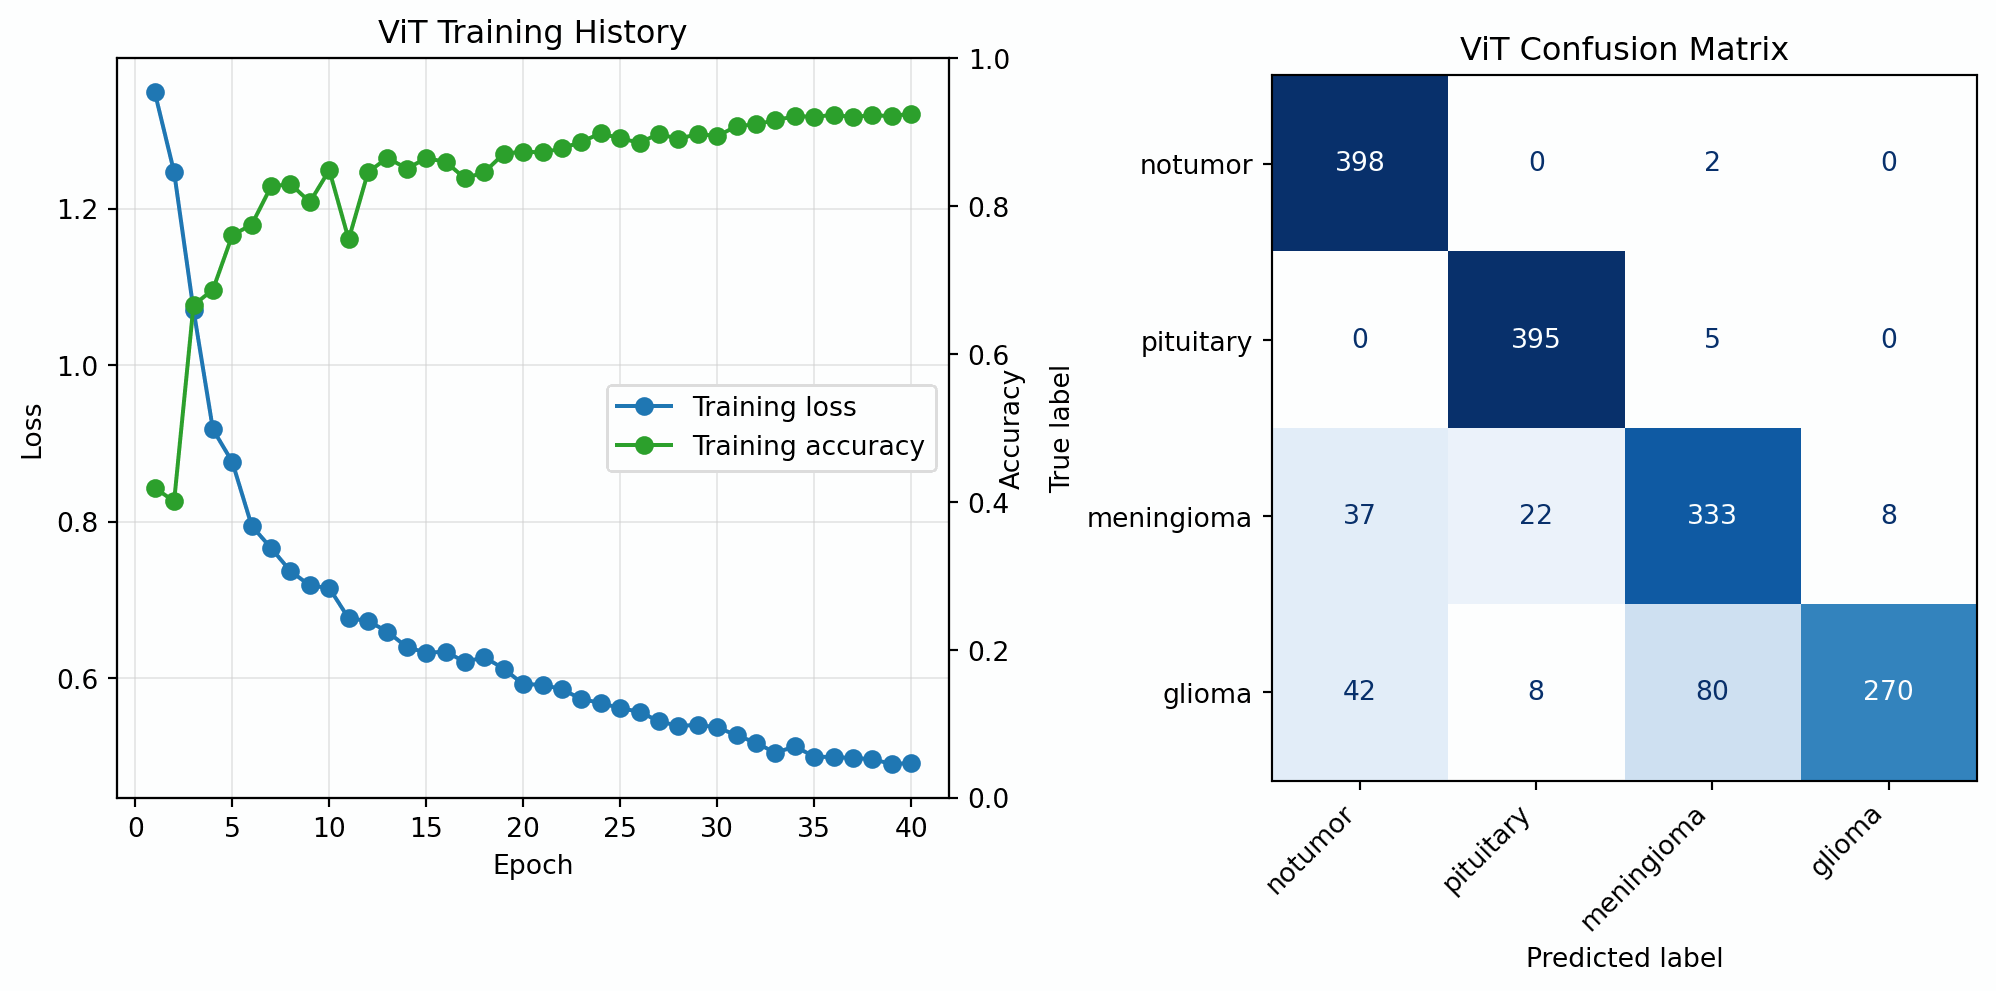
The hybrid CNN-ViT was trained with a linear warmup followed by a cosine annealing learning rate schedule, gradient norm clipping at 1.0, and label smoothing of 0.1 in the classification term of the hybrid loss. Test set predictions were averaged over five mildly augmented forward passes for test time augmentation. The final training history on the combined training and validation sets shows a steady decrease in training loss across the 45 final training epochs while training accuracy rises overall with some early fluctuation before leveling off near the end. However, because the final training accuracy is higher than the test performance there is evidence of some mild overfitting. The gap is not large enough to suggest that the model failed to generalize but it does show that additional regularization or validation based early stopping could potentially improve the model further.
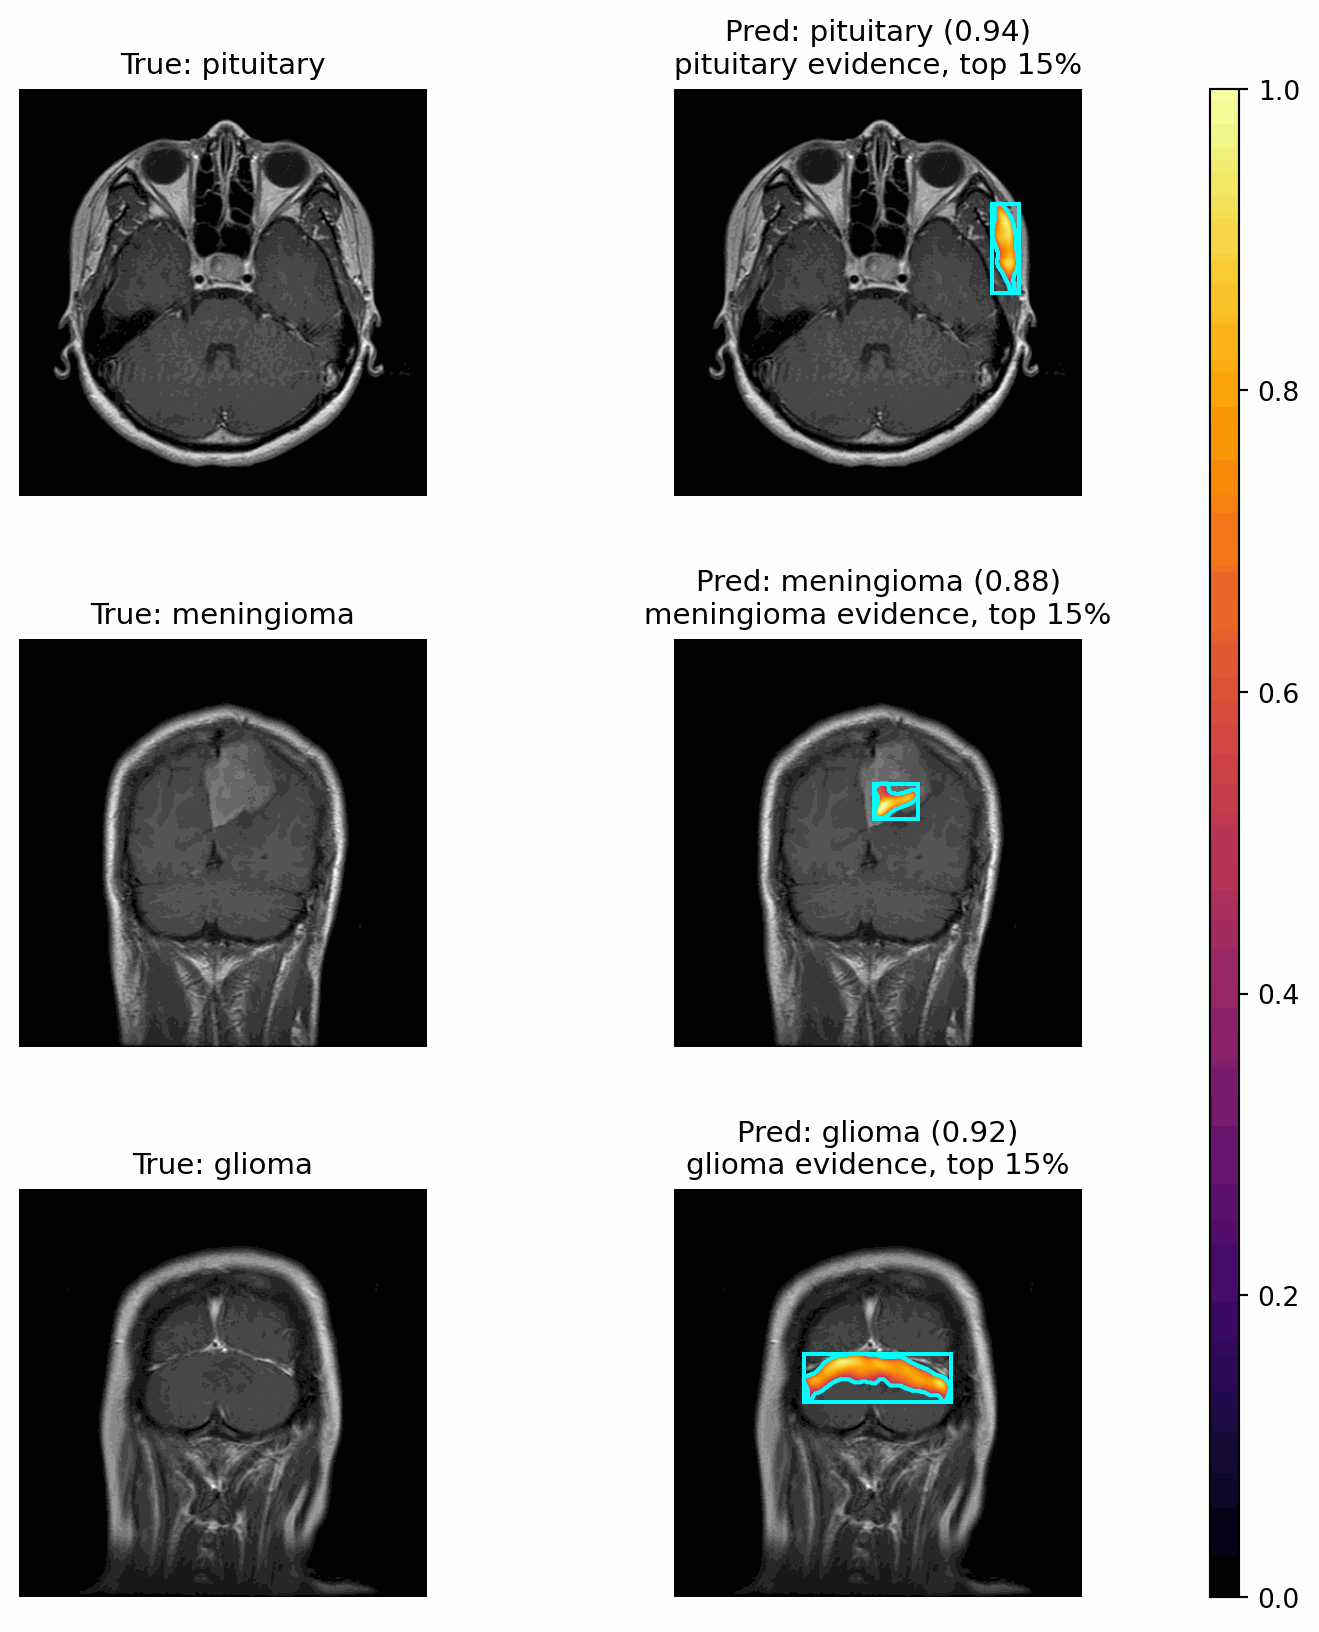
On the test set, the hybrid CNN-ViT achieved an accuracy of 0.9363, precision of 0.9401, recall of 0.9363, and F1 score of 0.9346. The confusion matrix shows that the model performed especially well on the no tumor and pituitary classes where it correctly classified 400 of 400 no tumor images and 399 of 400 pituitary images. Performance was weaker for the meningioma and glioma classes with 381 of 400 meningioma images and 318 of 400 glioma images classified correctly. The outside anatomy evidence ratio was 0.0010, which indicates that very little positive tumor class evidence fell outside the estimated anatomical region. The displayed evidence maps were therefore more useful for checking whether the model relied on plausible anatomy rather than obvious background artifacts. In these examples, the meningioma evidence overlapped the visible abnormal region, the glioma evidence covered a broader brain region where there is no obvious tumor (from a naive perspective), and the pituitary evidence remained inside head anatomy but was not centered on the apparent pituitary region. These examples demonstrate the interpretability mechanism but the maps should still be interpreted as class evidence rather than precise tumor segmentations.
Model Comparison
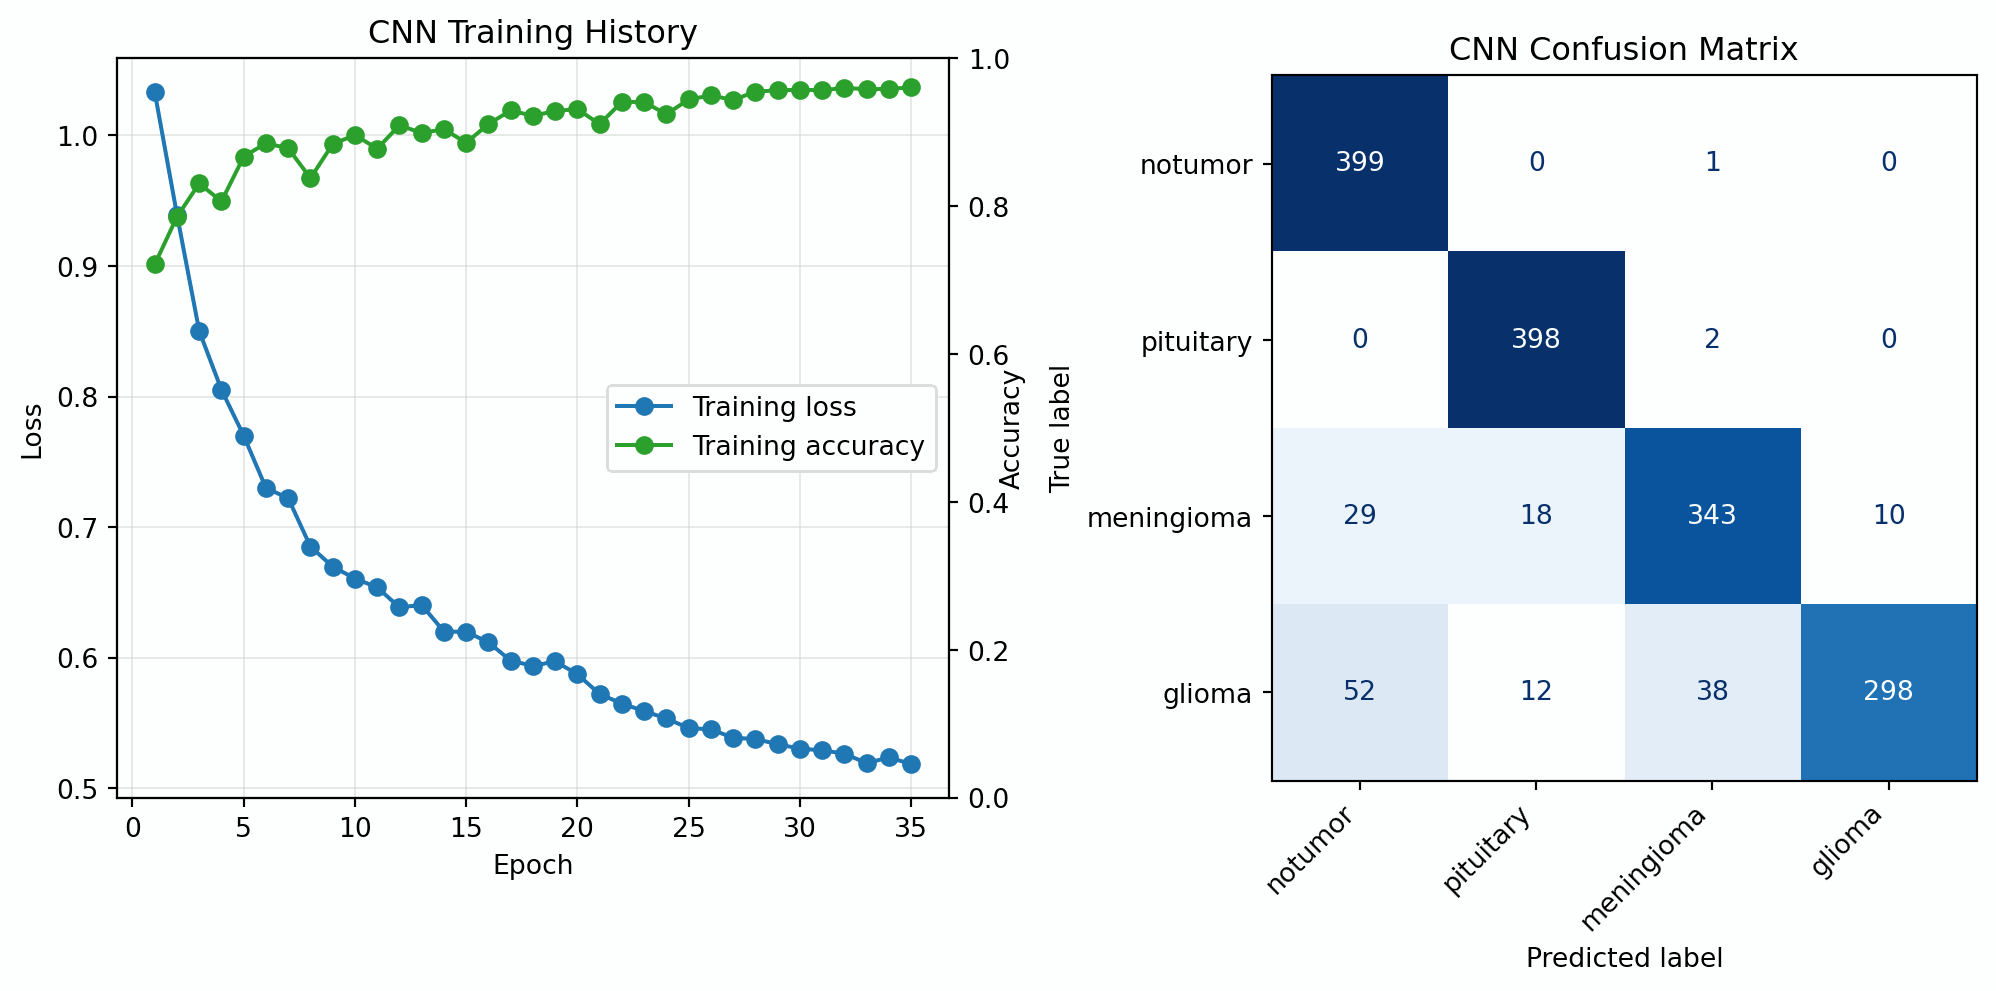
The hybrid CNN-ViT was the strongest performing model with an accuracy of 0.9363 and an F1 score of 0.9346. This placed it above the CNN which reached an accuracy of 0.8988 and F1 score of 0.8962 and the ViT which reached an accuracy of 0.8725 and F1 score of 0.8685. The largest benefit of the hybrid model was not on the easiest classes, where the hybrid and CNN both correctly classified every no tumor image and 399 of 400 pituitary images. Instead, the gains were concentrated in the harder tumor categories. For meningioma, the hybrid model correctly classified 381 images compared with 343 for the CNN and 333 for the ViT. For glioma, the hybrid model correctly classified 318 images compared with 298 for the CNN and 270 for the ViT. This suggests that combining CNN based local feature extraction with transformer based spatial modeling was most useful for distinguishing the more difficult tumor patterns. Including the evidence maps, along with the increased performance, shows the hybrid model having stronger potential for medical imaging applications where both accuracy and interpretability are important.
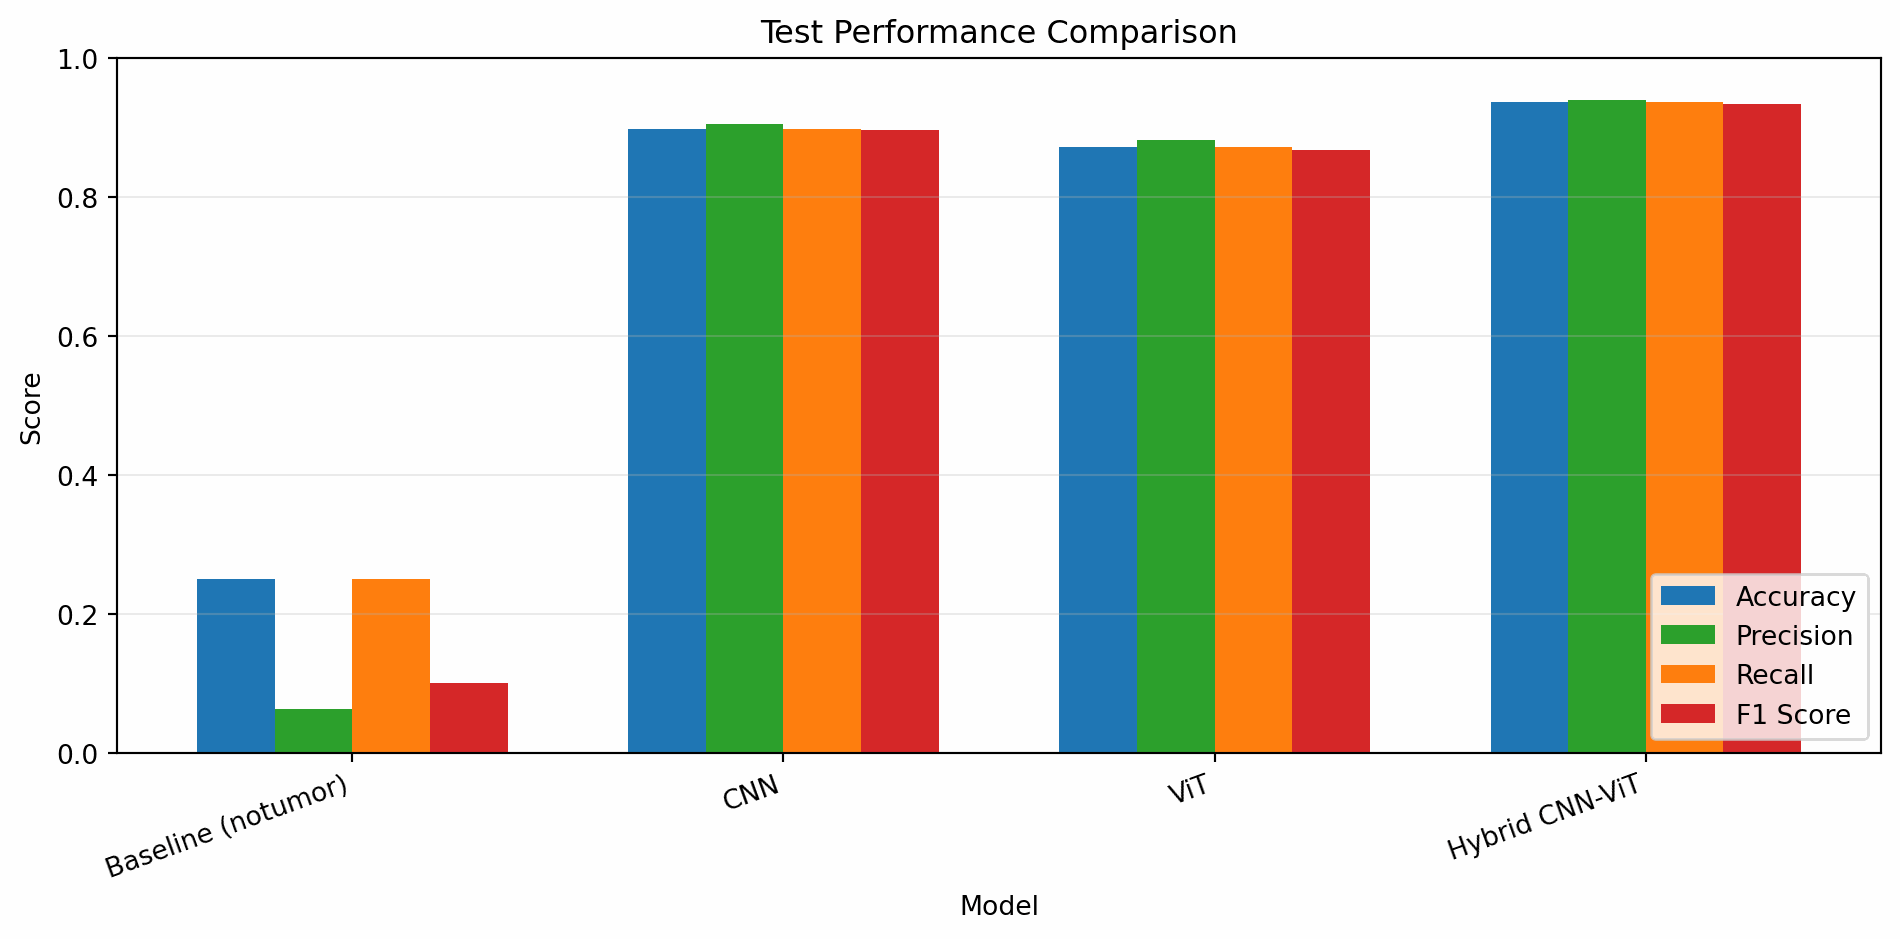
Best model by F1 score: Hybrid CNN-ViT (0.9346)| Model | Accuracy | Precision | Recall | F1 Score | Mean Evidence Magnitude | |
|---|---|---|---|---|---|---|
| 0 | Baseline (notumor) | 0.2500 | 0.0625 | 0.2500 | 0.1000 | NaN |
| 1 | CNN | 0.8988 | 0.9055 | 0.8988 | 0.8962 | NaN |
| 2 | ViT | 0.8725 | 0.8820 | 0.8725 | 0.8685 | NaN |
| 3 | Hybrid CNN-ViT | 0.9362 | 0.9401 | 0.9362 | 0.9346 | 0.4437 |
Conclusion
This paper focused on building and evaluating a hybrid CNN-ViT model for multiclass brain tumor MRI classification with the added goal of producing class-specific evidence maps. The final hybrid model achieved the best overall performance of the models tested, with an accuracy of 0.9363 and an F1 score of 0.9346 on the test set, with the largest gains on meningioma and glioma. This suggests that combining CNN based local feature extraction with transformer based spatial modeling can be useful for brain MRI classification because the model can use both small image patterns and broader spatial relationships. The evidence mechanism also helped address a key interpretability concern by keeping almost all positive tumor class evidence inside the estimated anatomical region, with an outside anatomy evidence ratio of 0.0010. However, the displayed examples still show that class evidence maps should not be interpreted as precise tumor segmentations. The meningioma evidence overlapped the visible abnormal region but the pituitary and glioma examples showed that useful class evidence can remain broader or appear away from the most obvious lesion location. Future work should focus on stronger evidence validation, class specific anatomical priors, and tumor localization supervision such as bounding boxes or segmentation masks.
References
[1]
“Tests for Brain Tumors in Adults.” https://www.cancer.org/cancer/types/brain-spinal-cord-tumors-adults/detection-diagnosis-staging/how-diagnosed.html.
[2]
F. J. Dorfner, J. B. Patel, J. Kalpathy-Cramer, E. R. Gerstner, and C. P. Bridge, “A review of deep learning for brain tumor analysis in MRI,” npj Precision Oncology, vol. 9, no. 1, p. 2, Jan. 2025, doi: 10.1038/s41698-024-00789-2.
[3]
C. Rudin, “Stop Explaining Black Box Machine Learning Models for High Stakes Decisions and Use Interpretable Models Instead,” Nature machine intelligence, vol. 1, no. 5, pp. 206–215, May 2019, doi: 10.1038/s42256-019-0048-x.
[4]
H. Chen, C. Gomez, C.-M. Huang, and M. Unberath, “Explainable medical imaging AI needs human-centered design: Guidelines and evidence from a systematic review,” npj Digital Medicine, vol. 5, no. 1, p. 156, Oct. 2022, doi: 10.1038/s41746-022-00699-2.
[5]
“Brain Tumor MRI Dataset.” https://www.kaggle.com/datasets/masoudnickparvar/brain-tumor-mri-dataset.
[6]
R. R. Selvaraju, M. Cogswell, A. Das, R. Vedantam, D. Parikh, and D. Batra, “Grad-CAM: Visual Explanations from Deep Networks via Gradient-based Localization,” International Journal of Computer Vision, vol. 128, no. 2, pp. 336–359, Feb. 2020, doi: 10.1007/s11263-019-01228-7.
[7]
A. Dosovitskiy et al., “An Image is Worth 16x16 Words: Transformers for Image Recognition at Scale.” arXiv, Jun. 2021. doi: 10.48550/arXiv.2010.11929.
[8]
K. Djoumessi, S. O. Mensah, and P. Berens, “A Hybrid Fully Convolutional CNN-Transformer Model for Inherently Interpretable Disease Detection from Retinal Fundus Images.” arXiv, Sep. 2025. doi: 10.48550/arXiv.2504.08481.